S&P500 Trading Update 16/4/26

S&P500 Trading Update 16/4/26
***QUOTING ES1! FOR CASH US500 EQUIVALENT LEVELS, SUBTRACT POINT DIFFERENCE***
WEEKLY BULL BEAR ZONE 6730/20
WEEKLY RANGE RES 6745/35 SUP 6955/75
April OPEX Straddle: 328.55pt range implies a OPEX to OPEX range of [6177, 6835]
June QOPEX Straddle is 546.4pt giving us a range of [5960,7052]
JHEQX Q2 Collar 6189/6290 - 6865/6955
DEC2025 OPEX to DEC2026 OPEX is 945 points giving us a range of [5889,7779]
SPX PUT/CALL RATIO 0.92 (The numbers reflect options traded during the current session. A put-call ratio below 0.7 is generally considered bullish, and a put-call ratio above 1.0 is generally considered bearish)
DAILY VWAP BULLISH 6908
WEEKLY VWAP BULLISH 6637
MONTHLY VWAP BULLISH 6815
DAILY STRUCTURE – OTFH - 7004
WEEKLY STRUCTURE – OTFH
MONTHLY STRUCTURE - OTFD - BALANCE
Balance: This refers to a market condition where prices move within a defined range, reflecting uncertainty as participants await further market-generated information. Our approach to balance includes favouring fade trades at the range extremes (highs/lows) while preparing for potential breakout scenarios if the balance shifts.
One-Time Framing Higher (OTFH): This represents a market trend where each successive bar forms a higher low, signalling a strong and consistent upward movement.
One-Time Framing Down (OTFD): This describes a market trend where each successive bar forms a lower high, indicating a pronounced and steady downward movement.
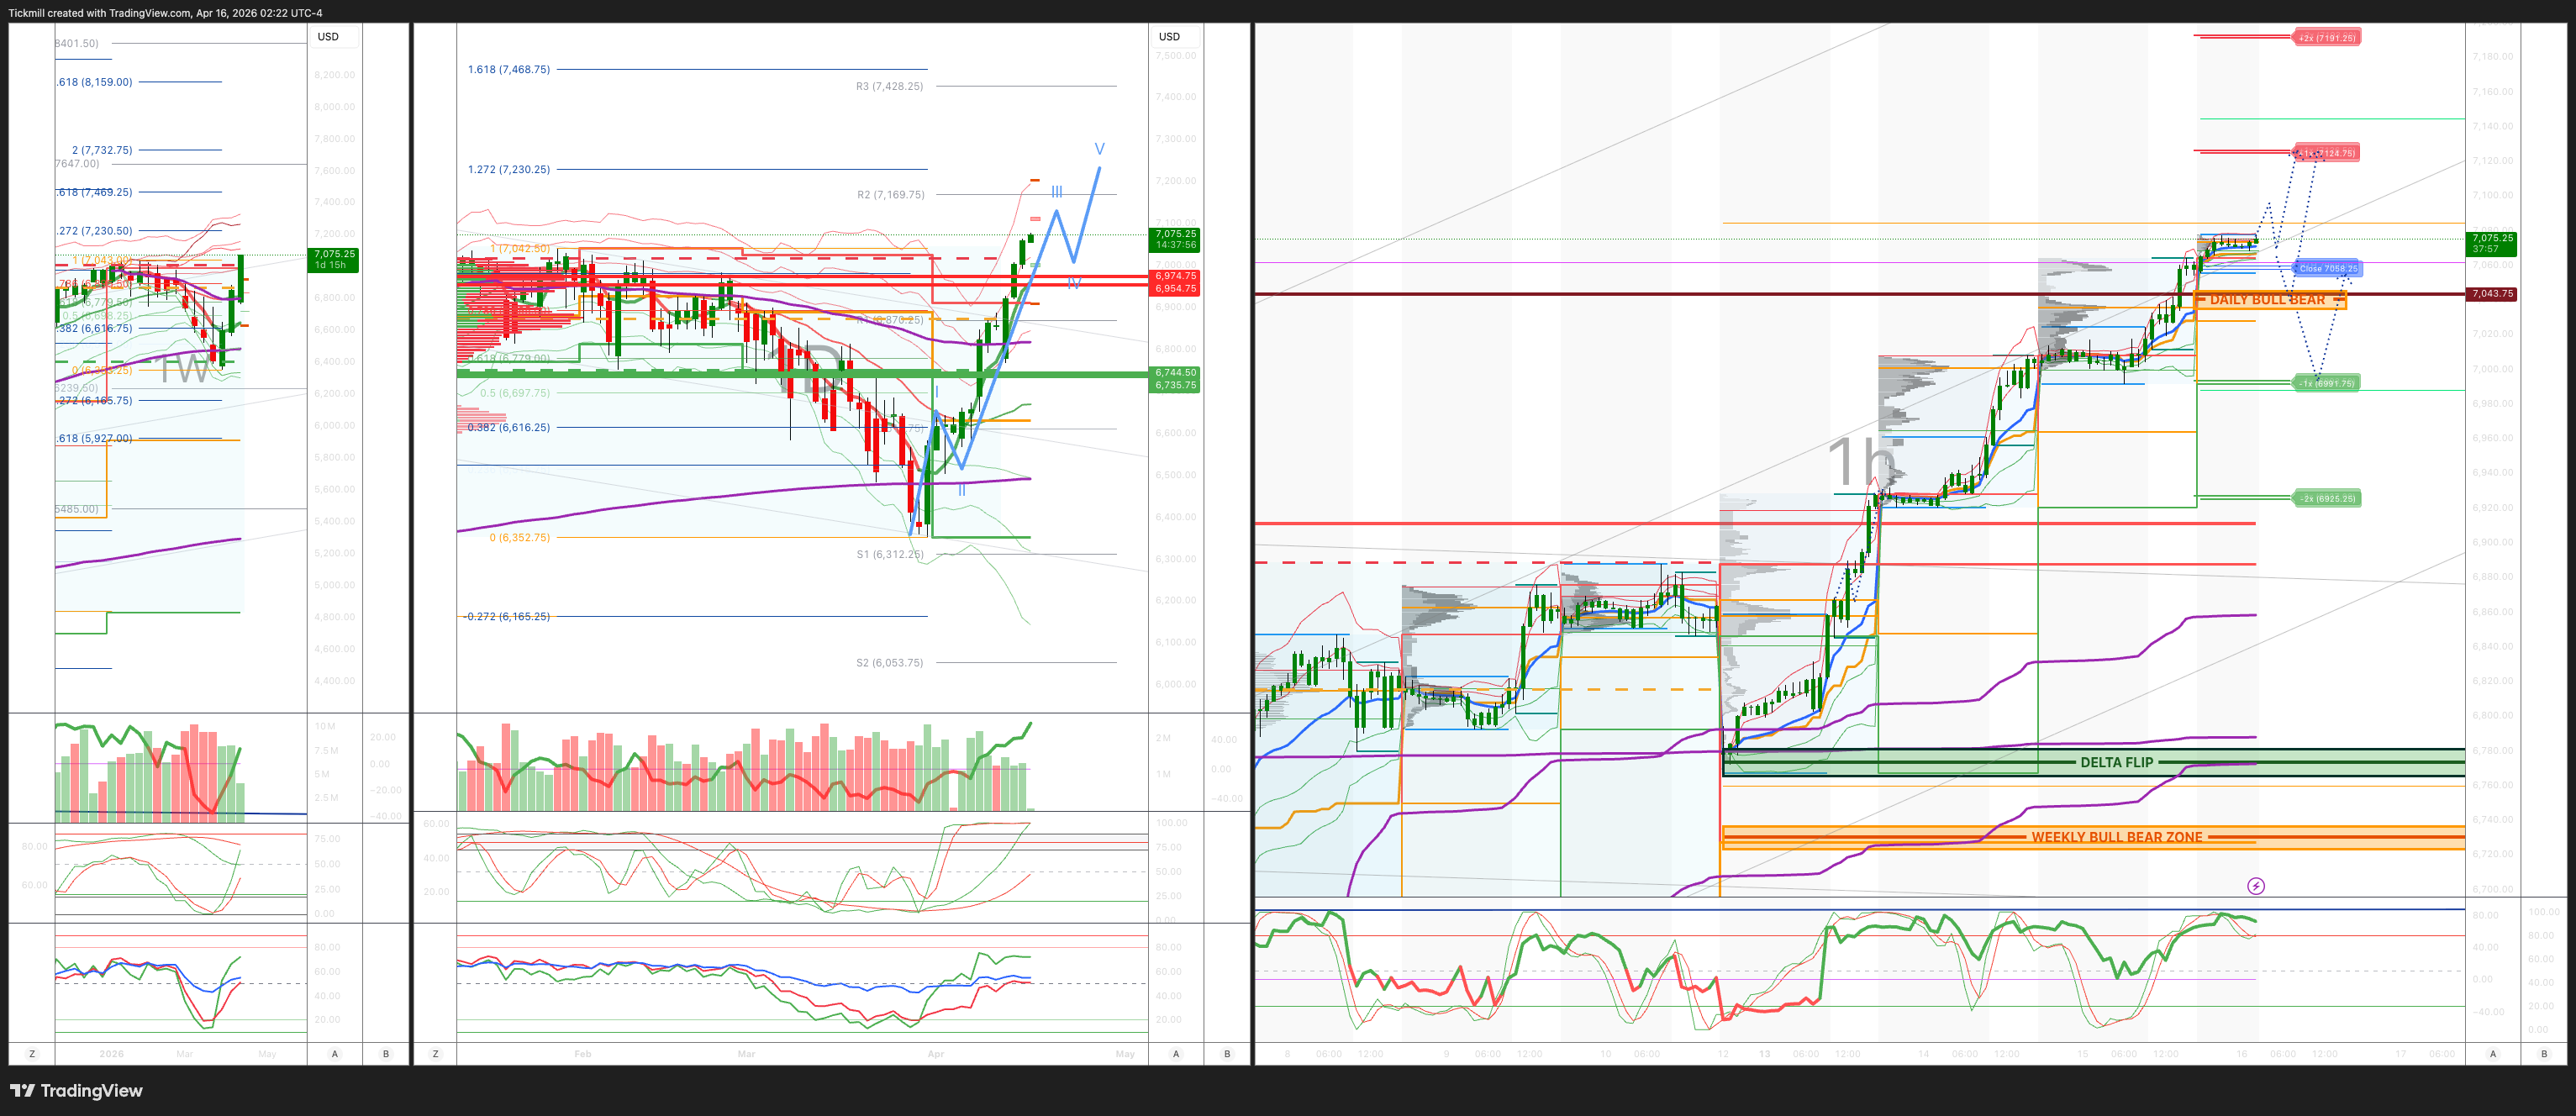
DAILY BULL BEAR ZONE 7045/35
DELTA FLIP 6774
DAILY RANGE RES 7124 SUP 6991
2 SIGMA RES 7191 SUP 6825
VIX BULL BEAR ZONE 19.5
TRADES & TARGETS
LONG ON REJECT/RECLAIM OF DAILY BULL BEAR ZONE TARGET DAILY RANGE RES
***ADDITIONAL SETUPS & TARGETS HIGHLIGHTED ON THE CHARTS***
(I FADE TESTS OF 2 SIGMA LEVELS ESPECIALLY INTO THE FINAL HOUR OF THE NY CASH SESSION AS 90% OF THE TIME WHEN TESTED THE MARKET WILL CLOSE ABOVE OR BELOW THESE LEVELS)
GOLDMAN SACHS TRADING DESK VIEW - ‘S&P 7000’
US equities were mixed but constructive on Wednesday, with the S&P 500 rising 0.80% to 7,023 and closing at a fresh record, alongside a $2.35bn MOC buy imbalance. The Nasdaq 100 gained 1.40% to 26,205, the Russell 2000 added 0.30% to 2,714, while the Dow slipped 0.15% to 48,464. Trading volume reached 18.7bn shares, modestly below the 2026 YTD average of 19.4bn.
The broader cross-asset backdrop was relatively contained. VIX fell 1.03% to 18.17, WTI was little changed at $91.38, and the US 10-year yield rose 3bp to 4.28%. Gold fell 1.05% to 4,791, the DXY was broadly flat at 98.10, and Bitcoin rose 0.87% to $74,775.
The session again had the feel of a cover-driven rally, with investors continuing to look through the macro and geopolitical headwinds of 2026 and toward the earnings season. Leadership was concentrated in large-cap growth and technology, with Tesla and Microsoft among the standout contributors, while the S&P Equal Weight finished flat, reinforcing how narrow the advance remained.
Under the surface, the session was also notable for the divergence between factors and sectors. Banks lagged, despite earnings reports generally being rewarded, likely reflecting the fact that the group remains relatively well owned versus other parts of the market. More broadly, popular hedge fund longs underperformed crowded shorts by 2%, reinforcing the sense that short covering, rather than fresh high-conviction long buying, remains a key driver of index performance.
One of the more important intra-sector moves came in Software versus Semis, where performance moved against consensus positioning. Software rallied roughly 5%, helped by idiosyncratic catalysts including GitLab (+8%) on a Google Cloud partnership, Cloudflare (+6%) on an upgrade, and Autodesk (+4%) on a buy initiation. By contrast, Semis traded weaker for most of the session, with ASML down 2.5% despite a beat-and-raise, after a sharp run into results and amid negative headlines around semiconductor infrastructure, including reports that Maine lawmakers passed a ban on large data centres. The move was widely seen as technical rather than fundamental, driven by momentum pressure and unwinds of the common long semicap / memory versus short enterprise software trade. While many investors remain fundamentally bearish on software, there were signs of growing unease around the sector’s week-to-date rally, and desks noted the first real cover bids emerging.
There was also meaningful focus on retail broker stocks, with Robinhood up 10% after a Wall Street Journal report suggesting that the potential end of the Pattern Day Trader rule could materially boost retail trading activity. The read-through for the group is that equity activity, crypto activity, and overall platform engagement are more interconnected than many investors assume. At the same time, the desks continue to stress that much of the move in the group has been driven by multiple expansions and momentum, even as earnings expectations remain under pressure.
Activity levels remained relatively subdued from a flow perspective, with the floor rated a 4/10. Even so, the desk finished +442bp to buy, versus a 30-day average of -8bp. Asset managers were approximately $700m net buyers, with demand concentrated in macro products, financials, and materials, offset by some supply in consumer discretionary. Hedge funds finished roughly $1bn as net sellers, driven primarily by a short supply of macro products.
In derivatives, the key theme was another spot up / vol up session, as less-loved areas of the market rallied even while geopolitical concerns were largely ignored. VIX expiry allowed some dealer gamma to roll off, giving the market more room to move, and the desk estimates maximum dealer long gamma positioning now sits around 2% lower from here. Vol was bid in both SPX and NDX, particularly in the front end, while skew continued to compress. SPX skew is now at the 56th percentile on a one-year lookback, down sharply from the 99th percentile seen at the start of the conflict, suggesting the market is becoming less focused on tail-risk hedging. The close itself was reinforced by another sizeable $2.35bn buy MOC, with CTAs continuing to add US equity exposure. Flow-wise, desks also highlighted renewed buying of volatility, particularly from macro accounts chasing the vol rally. Looking ahead, the next macro event is US jobless claims at 8:30am ET, with the SPX implied move through tomorrow at 0.53%.
Disclaimer: The material provided is for information purposes only and should not be considered as investment advice. The views, information, or opinions expressed in the text belong solely to the author, and not to the author’s employer, organization, committee or other group or individual or company.
Past performance is not indicative of future results.
High Risk Warning: CFDs are complex instruments and come with a high risk of losing money rapidly due to leverage. 71% and 74% of retail investor accounts lose money when trading CFDs with Tickmill UK Ltd and Tickmill Europe Ltd respectively. You should consider whether you understand how CFDs work and whether you can afford to take the high risk of losing your money.
Futures and Options: Trading futures and options on margin carries a high degree of risk and may result in losses exceeding your initial investment. These products are not suitable for all investors. Ensure you fully understand the risks and take appropriate care to manage your risk.
Patrick has been involved in the financial markets for well over a decade as a self-educated professional trader and money manager. Flitting between the roles of market commentator, analyst and mentor, Patrick has improved the technical skills and psychological stance of literally hundreds of traders – coaching them to become savvy market operators!